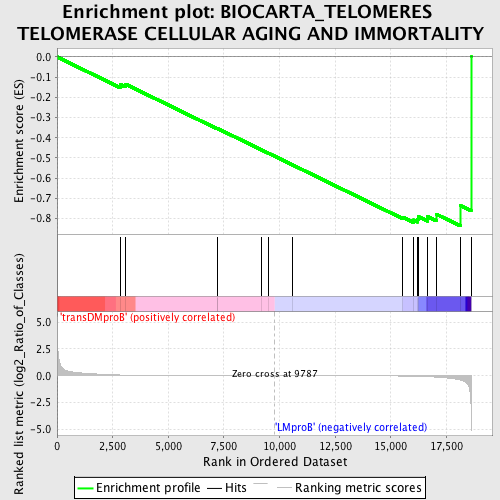
Profile of the Running ES Score & Positions of GeneSet Members on the Rank Ordered List
| Dataset | Set_04_transDMproB_versus_LMproB.phenotype_transDMproB_versus_LMproB.cls #transDMproB_versus_LMproB |
| Phenotype | phenotype_transDMproB_versus_LMproB.cls#transDMproB_versus_LMproB |
| Upregulated in class | LMproB |
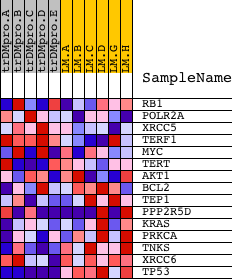
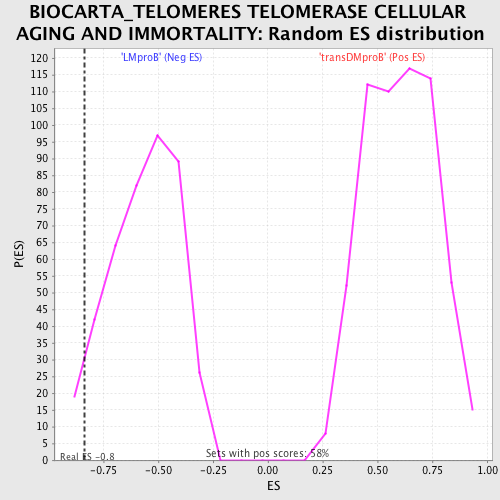
| GeneSet | BIOCARTA_TELOMERES TELOMERASE CELLULAR AGING AND IMMORTALITY |
| Enrichment Score (ES) | -0.8366846 |
| Normalized Enrichment Score (NES) | -1.4836929 |
| Nominal p-value | 0.045346063 |
| FDR q-value | 1.0 |
| FWER p-Value | 1.0 |
| PROBE | DESCRIPTION (from dataset) | GENE SYMBOL | GENE_TITLE | RANK IN GENE LIST | RANK METRIC SCORE | RUNNING ES | CORE ENRICHMENT | |
|---|---|---|---|---|---|---|---|---|
| 1 | RB1 | 21754 | 2835 | 0.067 | -0.1356 | No | ||
| 2 | POLR2A | 5394 | 3083 | 0.054 | -0.1351 | No | ||
| 3 | XRCC5 | 14229 | 7189 | 0.006 | -0.3544 | No | ||
| 4 | TERF1 | 14293 | 7219 | 0.005 | -0.3546 | No | ||
| 5 | MYC | 22465 9435 | 9167 | 0.001 | -0.4590 | No | ||
| 6 | TERT | 21604 | 9489 | 0.001 | -0.4761 | No | ||
| 7 | AKT1 | 8568 | 10560 | -0.001 | -0.5332 | No | ||
| 8 | BCL2 | 8651 3928 13864 4435 981 4062 13863 4027 | 15543 | -0.029 | -0.7937 | No | ||
| 9 | TEP1 | 21849 | 16008 | -0.046 | -0.8070 | Yes | ||
| 10 | PPP2R5D | 962 1523 22957 10139 | 16199 | -0.056 | -0.8032 | Yes | ||
| 11 | KRAS | 9247 | 16247 | -0.058 | -0.7910 | Yes | ||
| 12 | PRKCA | 20174 | 16649 | -0.088 | -0.7903 | Yes | ||
| 13 | TNKS | 5786 | 17046 | -0.131 | -0.7785 | Yes | ||
| 14 | XRCC6 | 2286 8991 | 18129 | -0.398 | -0.7362 | Yes | ||
| 15 | TP53 | 20822 | 18610 | -3.019 | 0.0003 | Yes |